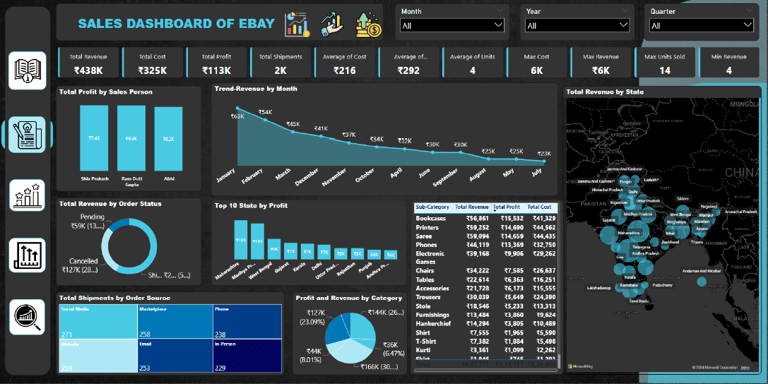


📊 Sales & Marketing Dashboards in POWER BI

Industry: E-commerce | Tool: Power BI
Problem:
Sales data from eBay was scattered and difficult to analyze, making it hard to track revenue, profit, and top-selling products.
Solution:
Designed an interactive Power BI dashboard that consolidates eBay sales data, showing revenue trends, product performance, and profit margins with drill-through insights.
Impact:
The client reduced manual reporting time by 80% and gained real-time visibility into sales performance for faster decision-making.
📊 Preview: (Click screenshot to view live dashboard)
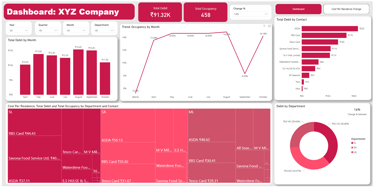
eBay Sales Dashboard
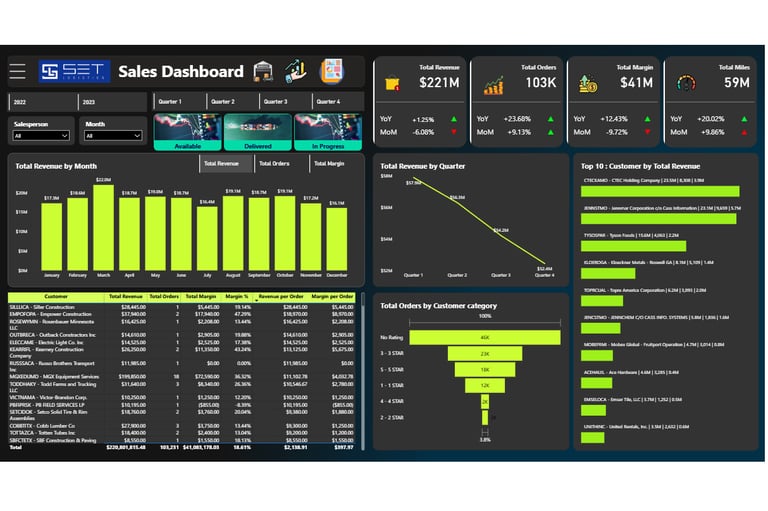
Logistics Sales & Inventory Dashboard
Client: Set Logistics | Tool: Power BI
Problem:
The client’s sales and inventory data was scattered across multiple files and systems, making it difficult to monitor stock levels, track order fulfillment, and analyze sales performance. Managers had no clear visibility into which products were running low, which regions were performing best, or how quickly stock was moving — leading to delays and inefficiencies in operations.
Solution:
I built an integrated Power BI dashboard that consolidated all sales and inventory data into one central view. The dashboard highlighted:
Real-time stock availability and movement
Regional sales performance with drill-down capability
Order fulfillment and delivery timelines
Alerts for low or excess stock
With this solution, the client could track KPIs instantly, identify bottlenecks, and make data-driven decisions to optimize logistics operations.
📊 Preview: (Click screenshot to view live dashboard)
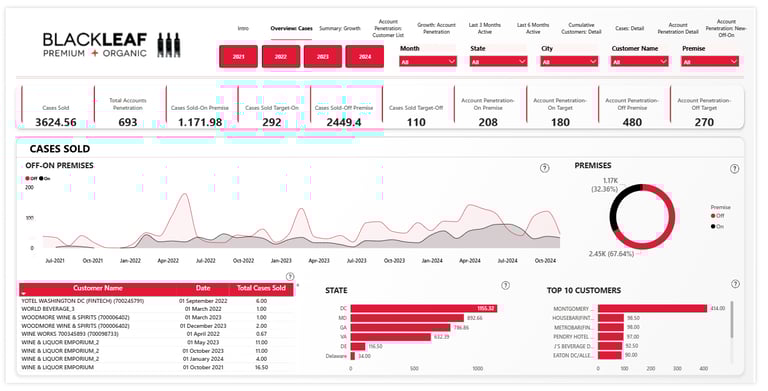
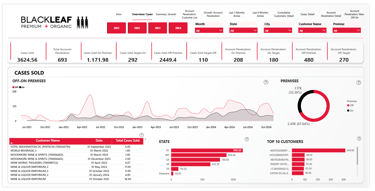
Sales Performance Dashboard – BlackLeaf Organic Vodka
Industry: Beverage | Tool: Power BI
Problem:
BlackLeaf Organic Vodka had difficulty tracking cases sold across different regions and distributors. Sales data was spread across multiple files, and reporting was slow and manual. The management team lacked a clear view of which regions and products were performing best, making demand forecasting and distributor performance evaluation challenging.
Solution:
I designed a 9-page Power BI dashboard that brought all sales data together into a single interactive report. The dashboard featured:
Regional and distributor-wise sales breakdown
Trend analysis of cases sold over time
Insights into top-performing products/SKUs
Forecast visuals for demand planning
Drill-through reports for distributor-level analysis
This gave the BlackLeaf team real-time visibility into sales performance, helping them track growth, improve forecasting, and make quicker business decisions.
📊 Preview: (Click screenshot to view live dashboard)
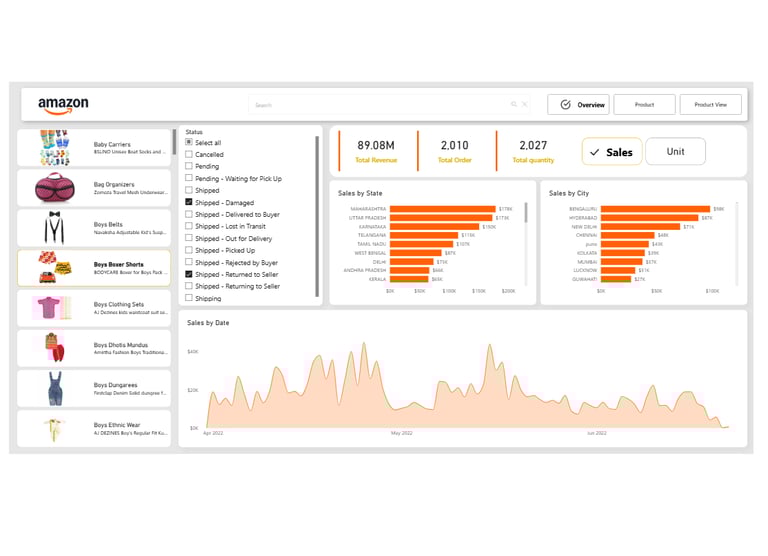
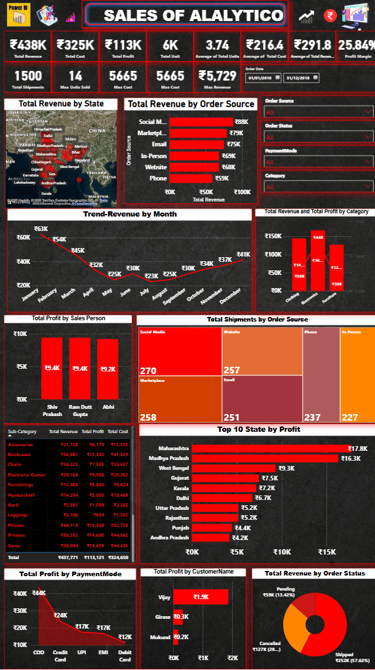
Amazon Seller Sales Dashboard
Industry: E-commerce | Tool: Power BI
Problem:
The client, an Amazon seller, faced challenges in tracking sales across multiple product categories. Data was coming from different reports, making it hard to monitor revenue, profit margins, and product performance in one place. This lack of consolidated insights led to delays in decision-making and missed opportunities for scaling top-selling items.
Solution:
I built a Power BI dashboard that centralized all Amazon sales data into an interactive report. The dashboard provided:
Product-wise and category-wise sales breakdown
Revenue, cost, and profit margin analysis
Top-performing vs. underperforming items
Trend analysis for daily, weekly, and monthly sales
Filters for drilling down by product, region, or time period
This solution gave the seller clear visibility into their business performance, reduced manual reporting time, and helped them quickly identify profitable items to scale.
📊 Preview: (Click screenshot to view live dashboard)
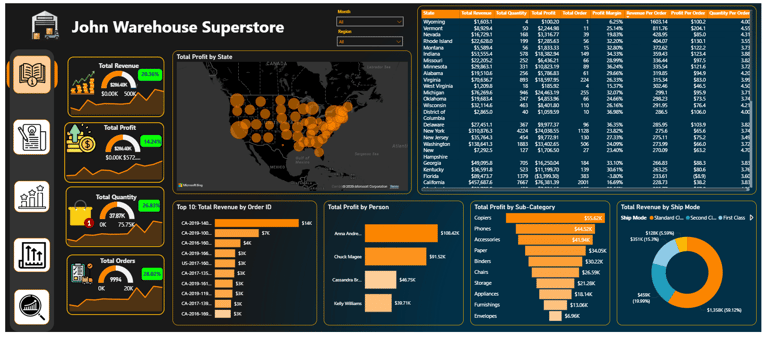
Warehouse & Sales Dashboard – John Warehouse Superstore
Industry: Retail & Wholesale | Tool: Power BI
Problem:
John Warehouse Superstore was struggling to monitor sales and inventory in real time. Data was stored in multiple spreadsheets, making it hard to track stock movement, top-selling products, and regional performance. This lack of visibility often led to overstocking, stockouts, and delays in identifying sales trends.
Solution:
I developed a Power BI dashboard that combined sales and warehouse data into one interactive report. Key features included:
Real-time sales tracking by category, product, and region
Inventory status with alerts for low or excess stock
Revenue and profit margin analysis
Trend visuals to identify best-performing periods
Drill-through for product-level and regional insights
This gave the superstore a complete view of its sales and warehouse operations, helping them reduce stock issues and make faster, data-driven business decisions.
📊 Preview: (Click screenshot to view live dashboard)
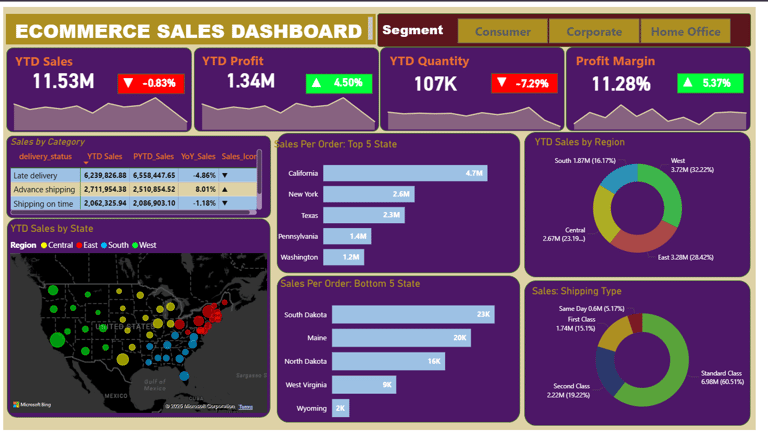
eCommerce Sales Dashboard
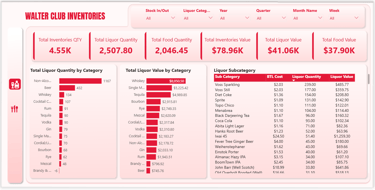
Inventory Management Dashboard – Walter Club
Industry: E-commerce | Tool: Power BI
Problem:
The client’s eCommerce business had sales data spread across different channels and reports, making it difficult to track overall performance. They lacked a consolidated view of sales, revenue, profit margins, and product performance. This made decision-making slow and prevented them from quickly identifying which products or campaigns were driving growth.
Solution:
I created an interactive Power BI dashboard that unified sales data from multiple sources into one report. The dashboard featured:
Revenue, sales, and profit margin analysis
Product-wise and category-wise performance tracking
Customer insights (repeat buyers vs. new buyers)
Regional sales distribution with filters
Trend analysis for monthly and seasonal performance
With this solution, the client gained real-time visibility into business performance, reduced manual reporting efforts, and could make faster, data-driven decisions to grow sales.
📊 Preview: (Click screenshot to view live dashboard)
Industry: Retail & Club Operations | Tool: Power BI
Problem:
Walter Club faced difficulties in managing their inventories across multiple categories. Stock levels were manually tracked, making it hard to identify low stock, overstock, and slow-moving items. This often resulted in delays, wastage, and missed opportunities to optimize purchasing decisions.
Solution:
I designed a Power BI inventory dashboard that centralized all inventory data into one easy-to-use report. Key features included:
Real-time stock tracking by item and category
Alerts for low stock and excess stock
Movement trends for fast-moving vs. slow-moving products
Supplier and purchase order tracking
Drill-through insights for category and product-level details
The dashboard gave Walter Club a clear, real-time view of their inventory, reducing stockouts and helping optimize purchasing decisions.
📊 Preview: (Click screenshot to view live dashboard)
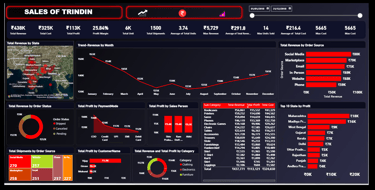
Other Sales Dashboard
Industry: Multi-sector | Tool: Power BI
A versatile Power BI dashboard built to track sales, revenue, and product performance with drill-through capabilities. Designed to help businesses monitor KPIs in real time and make informed sales decisions.
📊 Project & Task Management Dashboards
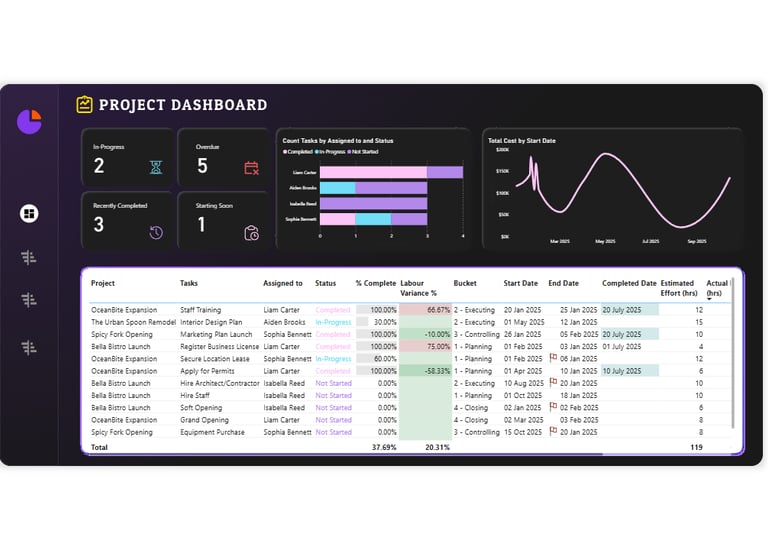
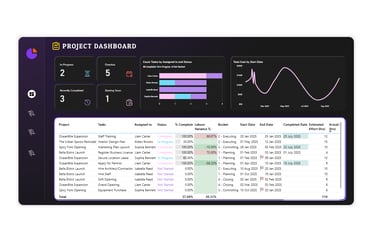
Industry: Project Management | Tool: Power BI + Figma (UI/UX Design)
Problem:
The client needed a clear way to monitor project timelines, tasks, and milestones across multiple teams. Existing tracking methods were scattered in spreadsheets, making it hard to follow deadlines, visualize progress, and manage workload distribution effectively.
Solution:
I designed a Power BI Project Management Dashboard with a custom UI/UX created in Figma. The main dashboard provides an overall view of project status and team performance, while three additional pages feature interactive Gantt charts for timeline tracking, milestone planning, and task dependencies. This solution brought all project insights into one place, helping the team manage projects more efficiently and stay on track with deadlines.
📊 Preview: (Click screenshot to view live dashboard)
Project Management Dashboard

Industry: Project Management | Tool: Microsoft Excel
Problem:
Teams often struggle to manage projects effectively in Excel due to scattered sheets, lack of automation, and difficulty in tracking tasks, deadlines, and progress in a single view.
Solution:
I created a ready-to-use Excel Project Management Template that allows users to manage tasks, deadlines, and project progress seamlessly. The template includes interactive features such as filters, automated tracking, and clean data visuals to simplify project monitoring.
🎥 Preview: (30-second demo video – watch how the template works)
Project Management Template in Excel
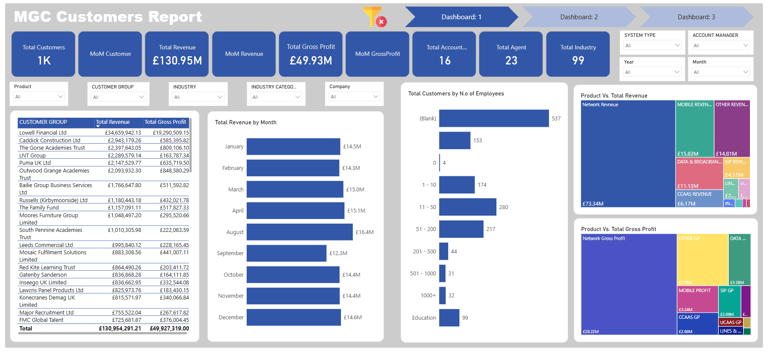
🙋♂️ Customer & Retention Dashboards
Industry: Customer Analytics | Tool: Power BI + Excel
Problem:
MGC needed a structured way to understand their customers’ behavior and retention patterns. Their customer data was spread across multiple sources, making it hard to track active vs. churned customers, identify trends, and segment customers for better decision-making. Without a clear view, the management team struggled to improve retention and customer satisfaction.
Solution:
I developed a 3-page Power BI customer report that consolidated all customer data into an interactive dashboard. The report included:
Overview page: Active, churned, and new customers with key KPIs
Trend analysis page: Monthly churn trends, retention rates, and customer growth
Segmentation page: Customer breakdown by demographics, region, and engagement level
This report gave MGC clear visibility into customer behavior, helping them track churn, improve retention strategies, and make data-driven business decisions.
📊 Preview: (Click screenshot to view live dashboard)
Customer Insights Report – MGC
Industry: Consumer Insights | Tool: Power BI + Excel
Problem:
Agilis Insight needed to analyze customer feedback to determine which product variation should be prioritized for mass production. Raw survey data was scattered and difficult to interpret, making it challenging to understand user preferences and identify the product with the highest demand potential.
Solution:
I built an interactive Power BI report that transformed survey feedback into actionable insights. The dashboard provided:
Product preference comparison across different user groups
Sentiment and satisfaction analysis from feedback data
Demographic and regional breakdown of customer choices
Clear ranking of products most likely to succeed in the market
This report enabled Agilis Insight to confidently select the right product for mass production, backed by data-driven insights rather than guesswork.
📊 Preview: (Click screenshot to view live dashboard)
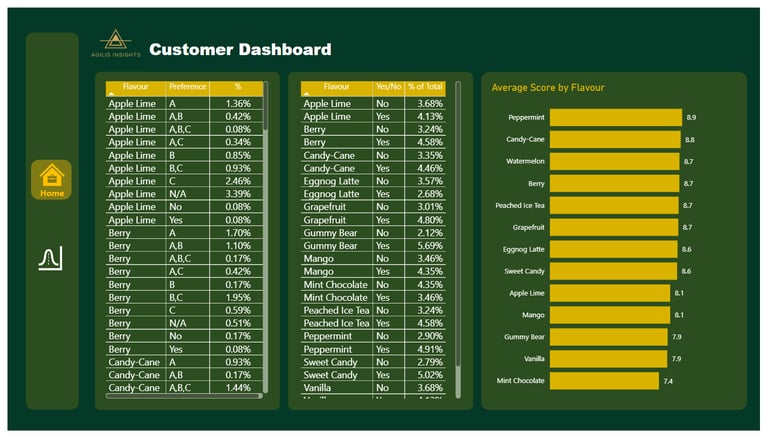
User Feedback Analysis Report – Agilis Insight
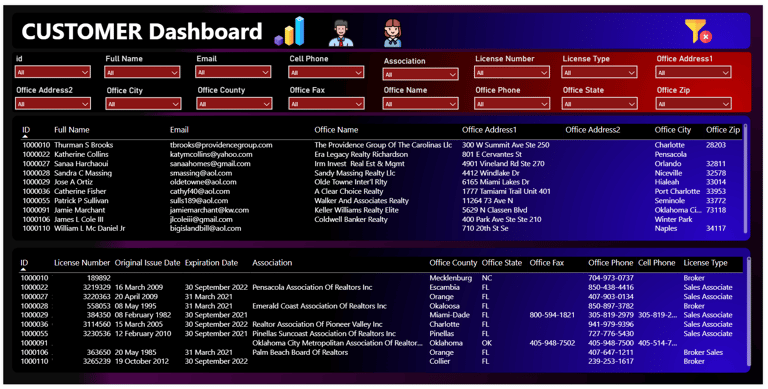
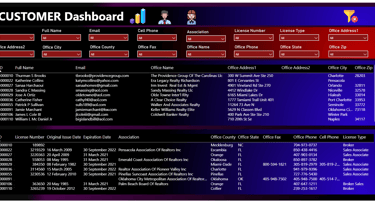
Customer Directory Dashboard
Industry: Multi-domain | Tool: Power BI
Problem:
The client had a large dataset of 1.5 million customer records containing details like state, city, email, fax, and office address. Searching for customer information manually in such a massive dataset was time-consuming and inefficient. Employees often struggled to quickly locate customer details, which slowed down operations and decision-making.
Solution:
I developed a Power BI dashboard optimized for fast search and filtering of customer records. Key features include:
Interactive filters (by state, city, and other attributes)
Table visualizations for quick lookup of customer details
Optimized performance to handle 1.5M+ rows without lag
User-friendly navigation for non-technical staff
This dashboard helped the client save time, reduce manual effort, and improve accessibility of customer data across teams.
👩💼 HR & Employee Analytics Dashboards
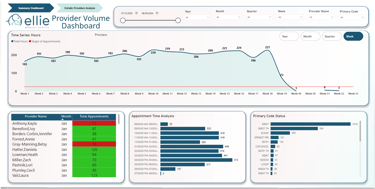
Problem:
Ellie Mental Health wanted to track and improve the performance of their therapists. They had data on therapist sessions, hours worked, client feedback, and ratings, but it was scattered and hard to interpret. Without clear visibility, it was difficult to measure therapist workload, quality of service, and overall client satisfaction.
Solution:
I designed a 4-page Power BI dashboard that centralized and visualized all therapist performance data. The report included:
Session & workload analysis – hours worked, number of clients seen
Feedback & rating insights – tracking satisfaction trends over time
Quality analysis – comparing therapist performance across key KPIs
Actionable insights – identifying top performers and areas for improvement
This enabled Ellie Mental Health to improve employee performance, ensure higher client satisfaction, and maintain consistent service quality.
📊 Preview: (Click screenshot to view live dashboard)
Therapist Performance & Feedback Dashboard – Ellie Mental Health

🏅 Sports & Performance Analytics Dashboards
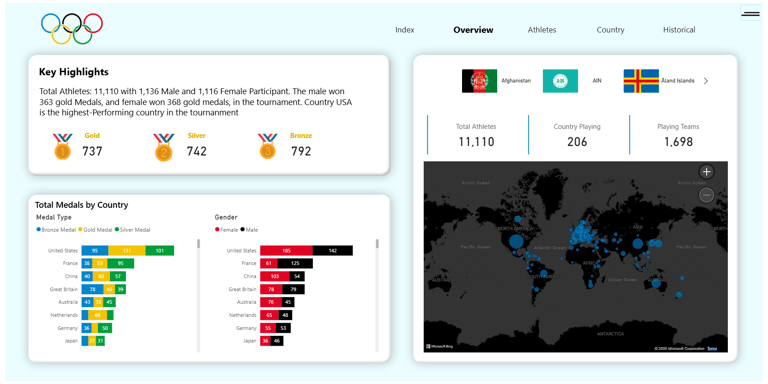
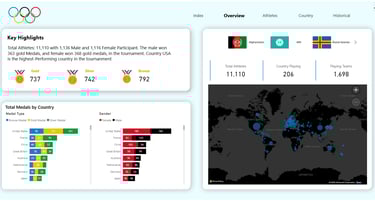
Problem:
Tracking Olympic performance, medal counts, and event statistics across multiple sports and countries can be overwhelming. Fans, analysts, and organizers often have to deal with scattered data sources, making it hard to get a clear, real-time picture of overall Olympic progress.
Solution:
I built an interactive Power BI dashboard that brings together key insights from the Paris Olympics 2024 into one unified view. It provides:
🥇 Medal tally by country, sport, and athlete
📊 Event-level breakdowns with filters for quick comparisons
🌍 Regional performance insights
⏱ Real-time updates and trend analysis
This dashboard makes it easy for stakeholders—whether fans, analysts, or officials—to monitor Olympic performance and uncover trends instantly.
🏅 Paris Olympics 2024 Insights Dashboard
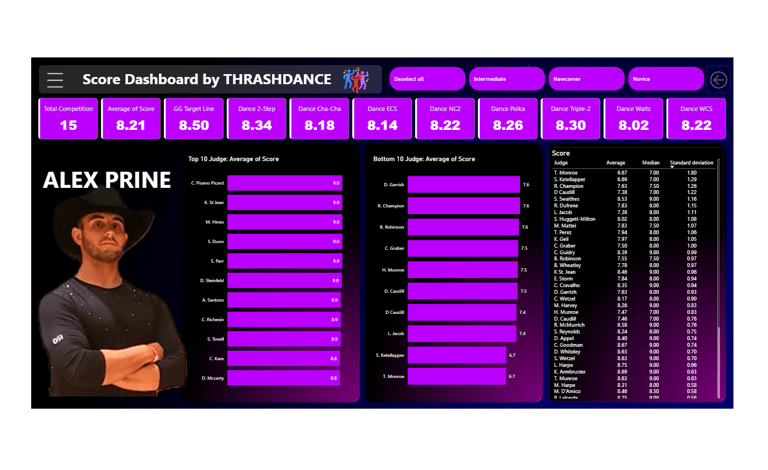
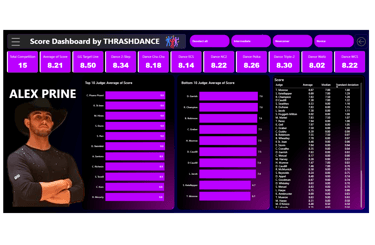
Problem:
Evaluating an athlete’s performance across different regions, timeframes, and judging panels can be complex. Each performance may receive varied scores depending on location, audience, and judge perspectives, making it difficult to identify patterns and areas of improvement.
Solution:
I designed a Power BI dashboard that centralizes and analyzes the athlete’s performance data across multiple dimensions. It provides:
📍 Region-wise performance breakdowns
⏱ Trend analysis by event and time
⭐ Judge-based scoring comparisons
🔎 Insights into strengths and improvement areas
This dashboard helps athletes, coaches, and managers understand how performances vary across regions and judges, enabling data-driven strategies for consistent improvement.
💃 Athlete Performance Dashboard
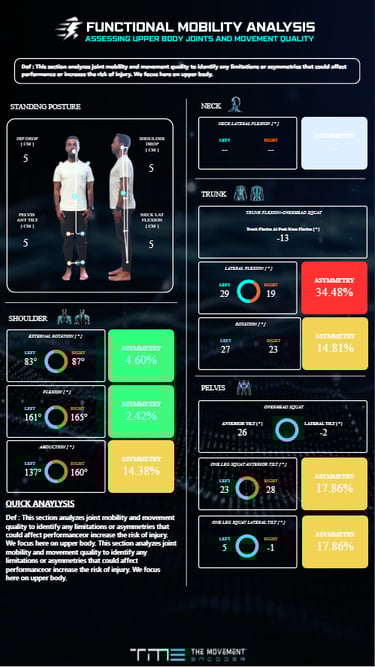
➡️ Health & Fitness Analytics / Health Data Dashboards
Category: Health Data Dashboards | Tool: Power BI | Pages: 14
Overview: Built for a National Football Coach, this dashboard analyzes athletes’ and individuals’ physical performance using testing devices like Dynamo and ForceDecks. It tracks strength, flexibility, balance, injury risk, and progress over time.
📌 Key Sections:
Overview & Profile – Athlete info + performance summary
Strength & Power – Grip, push/pull, jump & landing force analysis
Balance & Coordination – Left vs right symmetry, stability scores
Mobility & Flexibility – Range of motion across body parts
Injury Risk & Recovery – Risk indicators + recovery progress
Performance Trends – Improvement/decline across test periods
Athlete vs Population – Benchmarking vs general averages
Recommendations – Action plan, exercises, next test schedule
Impact: Helped coach identify weak areas, prevent injuries, and design training plans tailored to both professional athletes and normal individuals.
🏋️ Human Performance & Body Analysis Dashboard
Miscellaneous Dashboards
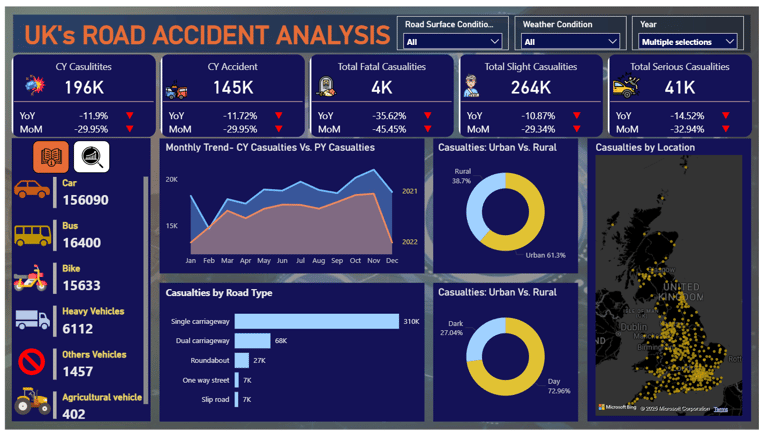
🛑 Problem
Road accidents in the UK involve multiple factors – location, weather, road type, vehicle type, and severity. Without a centralized and interactive system, it’s difficult for authorities, policymakers, and researchers to identify accident hotspots, patterns, and high-risk conditions.
✅ Solution
A Power BI interactive dashboard that consolidates accident data and makes it easy to analyze and explore. The dashboard enables stakeholders to quickly identify trends, improve road safety, and make data-driven decisions.
📊 Key Insights Available
Accident Trends Over Time – Monthly/Yearly patterns
Geographical Analysis – State/Region/City accident hotspots on maps
Severity Breakdown – Fatal, serious, and minor accidents
Contributing Factors – Weather conditions, road surface, lighting, etc.
Vehicle & Demographics – Accident involvement by vehicle type, age group, gender
Peak Times – Day of week & hour of day patterns
🖥️ Dashboard Features
Interactive filters for region, year, severity, and vehicle type
Drill-through to detailed location-level reports
Heatmaps & KPI cards to highlight accident-prone areas
Data storytelling through charts and tables for quick decision-making
UK Road Accident Report

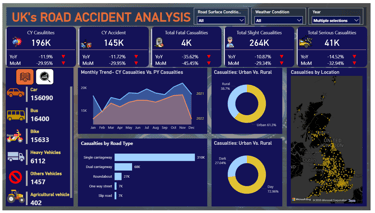
MyWhiskey – Cask Sales Dashboard
🛑 Problem
MyWhiskey needed a clear way to track and present their cask inventory (200L, 500L, etc.) to potential buyers. Spreadsheets and manual updates made it difficult to showcase available casks, pricing, and investment opportunities in a professional and interactive manner.
✅ Solution
A Power BI interactive dashboard was developed to help MyWhiskey manage their cask data and present insights directly to clients. This allows them to showcase available stock, highlight investment opportunities, and build trust with buyers through transparent data.
📊 Key Insights Available
Cask Inventory Overview – Types, sizes, and availability
Sales Insights – Which casks are in demand and performing best
Pricing Trends – Price variations across cask sizes & age
Client Presentation View – Simplified insights for investors and clients
Forecast & Opportunities – Helping identify potential profitable casks
🖥️ Dashboard Features
Client-ready, interactive storytelling dashboards
Drill-through options to explore cask-level details
Visual highlights of best-performing casks
Data presented in a clean and investor-friendly format
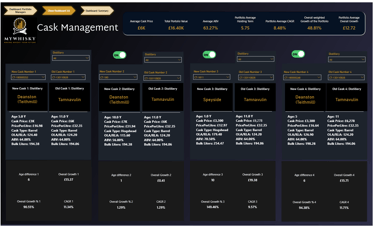
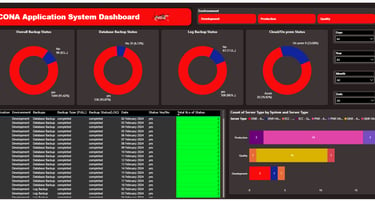
CONA Application System Dashboard
🛑 Problem
The company needed a way to track and manage employee applications and system usage more effectively. Data was scattered, making it hard to monitor performance, identify issues, and ensure smooth operations.
✅ Solution
I built a Power BI dashboard that consolidates all application-related data into one place. It helps employees and management easily monitor applications, system performance, and usage trends in real time.
📊 Key Insights Available
Application Tracking – Submitted, approved, pending, and rejected
System Usage Overview – Active users, peak times, bottlenecks
Employee Performance Metrics – Productivity and application handling
Error & Issue Monitoring – Identifying delays or failures quickly
🖥️ Dashboard Features
Centralized end-to-end application monitoring
Drill-through analysis for employee & application details
Interactive filters for departments, time, and status
Easy-to-use visuals for both employees and management
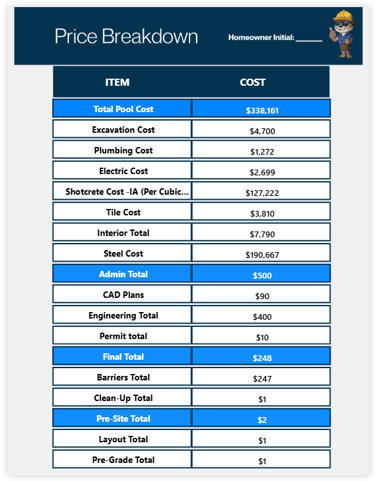

🛑 Problem
The client had multiple Excel sheets for pricing, making it time-consuming and error-prone to prepare pool proposals for customers. Each proposal required manual calculations and data lookups across different sheets.
✅ Solution
I created a dynamic Power BI/Excel template that pulls data from all pricing sheets into one centralized model. Now, the client only needs to apply filters (pool type, size, features, etc.) and the proposal is automatically generated.
📊 Key Insights Available
Centralized pool pricing data
Quick costing based on filters (pool type, size, region, add-ons)
Comparison between different pricing options
Automatic proposal-ready costing for clients
🖥️ Dashboard/Template Features
Time-saving automation (no more manual lookups)
User-friendly filter-based proposal creation
Interactive, error-free costing
Export-ready proposal outputs