Welcome to Our Services Page
I am Vikas, a dedicated data analyst specializing in creating interactive dashboards and insightful reports using various tools to transform data into clear, actionable analytics for informed decision-making.
Your Data, Our Insights
Crafting Data Stories
With expertise in connecting diverse data sources, I build engaging visualizations that empower businesses to leverage their data effectively, ensuring clarity and actionable insights for strategic growth.
Our Data Services
Interactive dashboards and insightful reports tailored to your data needs.


🔍 Data Analysis Services
Business Data Analysis (Sales, Marketing, Financial, HR, etc.)
KPI & Metric Identification and Optimization
Exploratory and Statistical Data Analysis
Trend, Pattern & Root Cause Analysis
Forecasting and Predictive Insights (Basic Level)
Maintaining Data and Protection
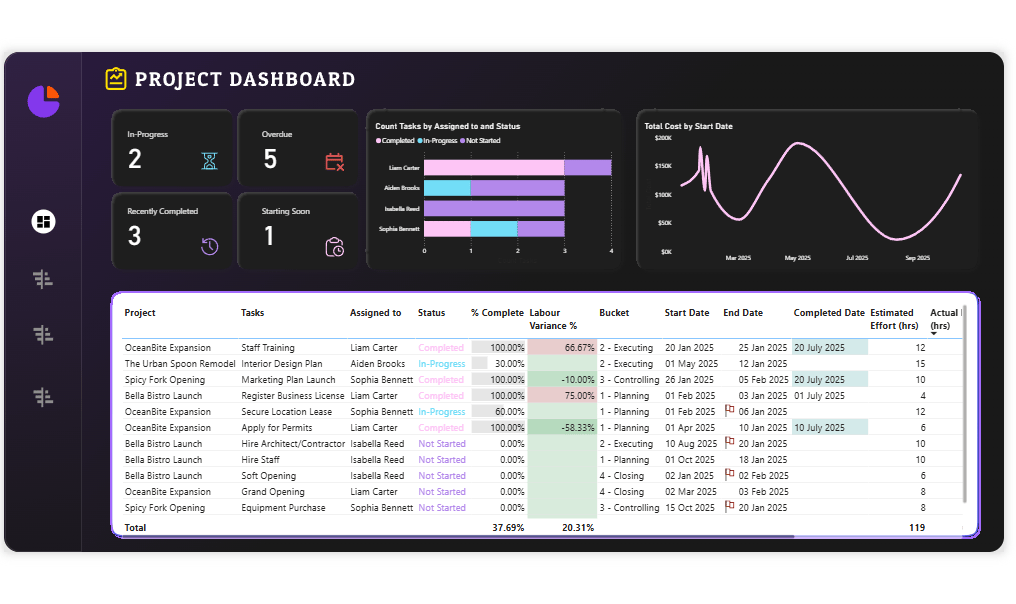
📊 Dashboard & Report Development
Interactive Power BI Dashboard Creation
Excel Dashboard Creation (with Power Query & Pivot)
Google Sheets Dashboard Setup
Looker Studio Report Building
Cross-platform Dashboard Integration
Executive Summary Dashboards
E-commerce Analytics Dashboards
HR, Finance, Logistics, and Healthcare Dashboards
🛠️ ETL & Data Preparation
Data Cleaning & Preprocessing
Power Query Transformation Workflows
Data Modeling & Relationship Management
DAX Calculations & Custom Measures
Combining and Integrating Multiple Data Sources
☁️ Data Source Integration
Excel, CSV, JSON, XML, TXT files
SQL, MySQL, PostgreSQL, MongoDB
SharePoint, OneDrive, Google Sheets, Microsoft Dataverse
REST APIs, CRM Exports, ERP Tools
Snowflake, Azure, Google BigQuery (Read-Only Data)
⚙️ Automation & Report Scheduling
Data Refresh Automation Setup
Scheduled Email Reports (Daily/Weekly/Monthly)
File Drop Automations & Folder Integration
Workflow Optimization (No-Code/Low-Code tools)
🧩 Consultation & Troubleshooting
One-on-One Power BI/Excel Consultation
Dashboard Performance Optimization
Troubleshooting Report Errors & Data Mismatches
Help with Power BI Service Setup & Deployment
SharePoint & Teams Power BI Integration Support